July 2014
5 links saved this month.
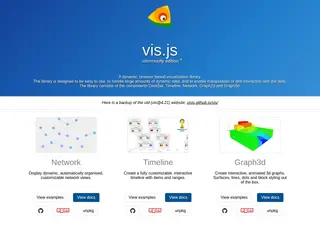
visjs.org
vis.js is a dynamic, browser-based visualization library
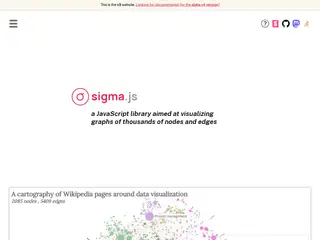
sigmajs.org
Home page of Sigma.js, a JavaScript library that renders and lets you interact with large network graphs in the browser using WebGL.
code.shutterstock.com
Rickshaw is an open-source JavaScript toolkit for creating interactive time-series graphs and charts
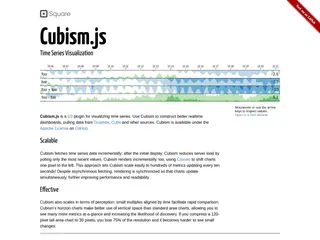
square.github.io
Home page of Cubism.js, a D3 plugin for time-series visualisation that renders incrementally on canvas to drive real-time dashboards from sources such as Graphite.